Distributed Fiber Optic Sensor Market Size, Share & Trends Analysis Report
Distributed Fiber Optic Sensor Market Size, Share & Trends Analysis Report By Function (Acoustic/ Vibration Sensing, Temperature Sensing), By Technology (Rayleigh Effect, Raman Effect), By Application, By Vertical, By Region, And Segment Forecasts, 2026 - 2033
分散型光ファイバーセンサー市場 - 機能別(音響/振動センシング、温度センシング)、技術別(レイリー効果、ラマン効果)、アプリケーション別、垂直市場別、地域、セグメント別予測による市場規模、成長と動向分析レポート 2026-2033年
| 出版 | Grand View Research |
| 出版年月 | 2025年12月 |
| ページ数 | 150 |
| 価格 | 記載以外のライセンスについてはお問合せください |
| シングルユーザ | USD 4,950 |
| 種別 | 英文調査報告書 |
| 商品番号 | SMR-1225712257 |

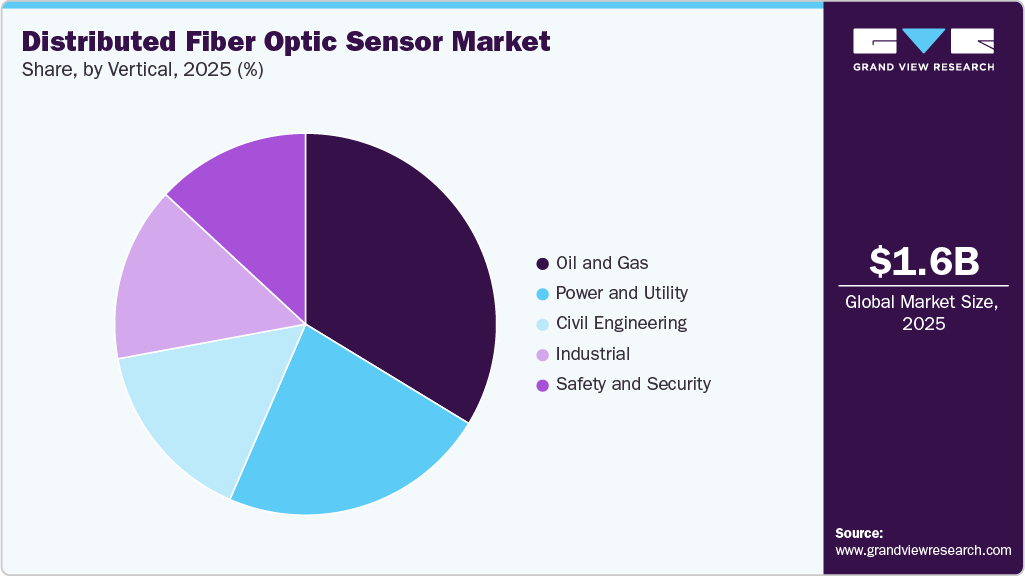
世界の分散型光ファイバーセンサー市場規模は、2025年に16億4,000万米ドルと評価され、2033年には39億9,000万米ドルに達すると予測されており、2026年から2033年にかけて年平均成長率(CAGR)11.9%で成長する見込みです。重要なインフラ全体でのリアルタイム監視の導入拡大、分散型光ファイバーセンサー(DFOS)プラットフォームにおけるAIと高度な分析の統合の進展、過酷な遠隔地への展開の増加、スマートシティや環境監視におけるユースケースの拡大、カスタマイズされた設置および保守サービスの需要の加速などが挙げられます。
この業界は、複数の業界で高度なリアルタイム監視ソリューションに対する需要の高まりに牽引され、急速に進化するセンシング技術の分野を表しています。これらのシステムは光ファイバーを活用して長距離で温度、ひずみ、音響の変化を測定し、高精度な継続的なデータ収集を可能にします。石油・ガス、電力・公益事業、土木工学などの主要セクターでは、運用上の安全性の強化、資産パフォーマンスの向上、ダウンタイムの削減のために、これらのセンサーへの依存度が高まっています。例えば、2024年9月、SLBはPatterson-UTIおよびADNOC Drilling Company PJSCと合弁事業を開始し、Turnwell Industries LLC OPCを設立しました。これは、スマート掘削設計、AI主導の生産能力、および仕上げエンジニアリングを推進し、UAEの非在来型石油・ガス開発を加速することを目的としています。インフラネットワークがより複雑化し、地理的に分散するにつれて、信頼性が高く高精度な光ファイバーセンシングソリューションに対する需要は高まり続けています。
分散型光ファイバーセンサーをベースとした境界セキュリティシステムは、空港、国境、公共施設、そして継続的な脅威検知が求められる重要施設において、最適なソリューションとして台頭しています。足音、車両、掘削、切断、登攀といった動作を区別できるこの技術は、急速な導入を促進しています。多くの組織は、精度向上と誤報の削減を目指し、従来のポイントセンサーから光ファイバーベースのシステムに移行しています。世界的なセキュリティへの懸念の高まりとインフラの脆弱性により、音響ベースの光ファイバー検知への関心がさらに高まっています。こうした需要の高まりにより、DFOSは次世代境界セキュリティネットワークの基盤技術として位置付けられています。
Distributed Fiber Optic Sensor Market Summary
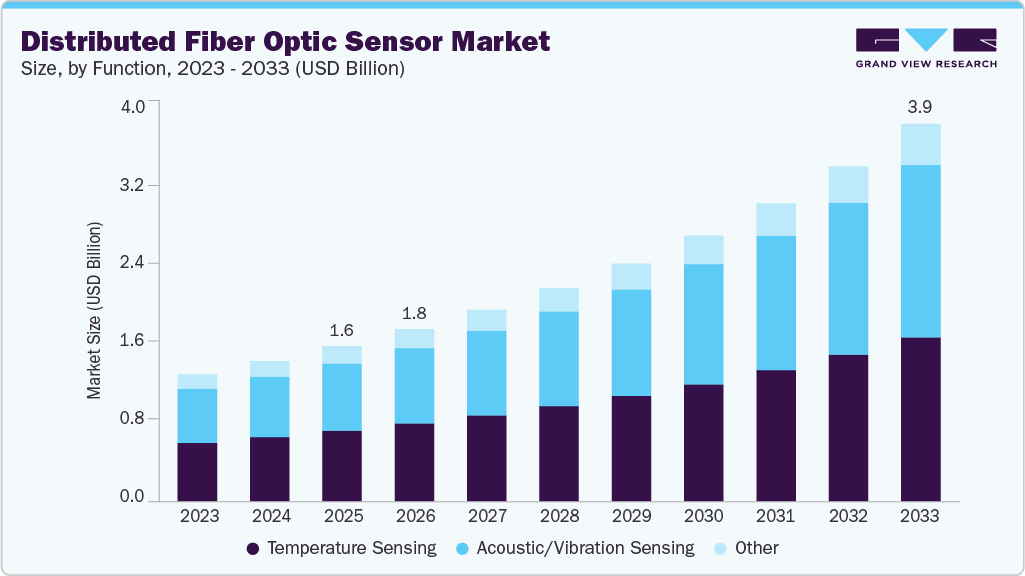
The global distributed fiber optic sensor market size was valued at USD 1.64 billion in 2025 and is projected to reach USD 3.99 billion by 2033, growing at a CAGR of 11.9% from 2026 to 2033. The growing adoption of real-time monitoring across critical infrastructure, rising integration of AI and advanced analytics in distributed fiber optic sensor (DFOS) platforms, increasing deployment in harsh and remote terrains, expanding use cases in smart cities and environmental monitoring, and accelerating demand for customized installation and maintenance services.
distributed-fiber-optic-sensor-sensing-market-size
The industry represents a rapidly evolving segment of sensing technology, driven by rising demand for advanced, real-time monitoring solutions across multiple industries. These systems leverage optical fibers to measure temperature, strain, and acoustic variations over long distances, enabling continuous data collection with high precision. Key sectors, including oil and gas, power and utilities, and civil engineering, increasingly depend on these sensors to strengthen operational safety, improve asset performance, and reduce downtime. For instance, in September 2024, SLB entered a joint venture with Patterson-UTI and ADNOC Drilling Company PJSC to establish Turnwell Industries LLC OPC, aimed at advancing smart drilling design, AI-driven production capabilities, and completions engineering to accelerate the UAE’s unconventional oil and gas development. As infrastructure networks grow more complex and geographically distributed, the demand for reliable, high-accuracy fiber optic sensing solutions continues to intensify.
Distributed fiber optic sensors based perimeter security systems are emerging as a preferred solution for airports, borders, utilities, and critical facilities that require continuous threat detection. Technology’s ability to differentiate between footsteps, vehicles, digging, cutting, and climbing activities is driving rapid adoption. Organizations are shifting from legacy point sensors to fiber-based systems to improve accuracy and reduce false alarms. Rising global security concerns and infrastructure vulnerability are further intensifying interest in acoustic-based fiber detection. This accelerating demand positions DFOS as a cornerstone technology for next-generation perimeter security networks.
Telecom operators and energy companies are rapidly adopting DFOS to monitor thousands of kilometers of submarine fiber cables for temperature shifts, vibration anomalies, and external threats. Distributed sensing enables early detection of anchor drags, seismic activity, and cable stress, reducing the risk of lengthy outages and costly repairs. Increasing global dependence on data transport and offshore energy infrastructure is accelerating investment in long-range DFOS deployments. Operators view fiber-based monitoring as a strategic capability for protecting mission-critical communication routes. This growing adoption trend is driving significant innovation in long-distance optical interrogation technologies.
Distributed Fiber Optic Sensor Market Report Scope
| Report Attribute | Details |
| Market size value in 2026 | USD 1.82 billion |
| Revenue forecast in 2033 | USD 3.99 billion |
| Growth rate | CAGR of 11.9% from 2026 to 2030 |
| Base year for estimation | 2025 |
| Historical data | 2021 – 2024 |
| Forecast period | 2026 – 2033 |
| Quantitative units | Revenue in USD million/billion, and CAGR from 2026 to 2033 |
| Report coverage | Revenue forecast, company ranking, competitive landscape, growth factors, and trends |
| Segments covered | Function, technology, application, vertical, region |
| Regional scope | North America; Europe; Asia Pacific; Latin America; MEA |
| Country scope | U.S.; Canada; Mexico; UK; Germany; France; China; Japan; India; South Korea; Australia; Brazil; KSA; UAE; South Africa |
| Key companies profiled | Schlumberger Limited; Halliburton; Yokogawa Electric Corporation; OFS Fitel, LLC; Omnisens SA; Brugg Kable AG; AP Sensing GmbH; Baker Hughes Company; Silixa Ltd; Luna Innovations Inc. |
| Customization scope | Free report customization (equivalent up to 8 analysts working days) with purchase. Addition or alteration to country, regional & segment scope. |
Global Distributed Fiber Optic Sensor Market Report Segmentation
This report forecasts revenue growth at global, regional, and country levels and provides an analysis of the industry trends in each of the sub-segments from 2021 to 2033. For this study, Grand View Research has segmented the global distributed fiber optic sensor (DFOS) market report based on function, technology, application, vertical, and region.
- Function Outlook (Revenue, USD Million, 2021 – 2033)
- Acoustic/ Vibration Sensing
- Temperature Sensing
- Other
- Technology Outlook (Revenue, USD Million, 2021 – 2033)
- Rayleigh Effect
- Brillouin Scattering
- Raman Effect
- Interferometric
- Bragg Grating
- Application Outlook (Revenue, USD Million, 2021 – 2033)
- Geophysical Event Monitoring
- Network Disturbance Monitoring
- Rail Infrastructure Monitoring
- Urban Monitoring
- Subsea Infrastructure Monitoring
- Others
- Vertical Outlook (Revenue, USD Million, 2021 – 2033)
- Oil and Gas
- Power and Utility
- Safety and Security
- Industrial
- Civil Engineering
- Regional Outlook (Revenue, USD Million, 2021 – 2033)
- North America
o U.S.
o Canada
o Mexico
- Europe
o UK
o Germany
o France
- Asia Pacific
o China
o Japan
o India
o South Korea
o Australia
- Latin America
o Brazil
- Middle East and Africa (MEA)
o KSA
o UAE
o South Africa
Table of Contents
Chapter 1. Methodology and Scope
1.1. Market Segmentation and Scope
1.2. Market Definition
1.3. Research Methodology
1.3.1. Information Procurement
1.3.2. Information or Data Analysis
1.3.3. Market Formulation & Data Visualization
1.3.4. Data Validation & Publishing
1.4. Research Scope and Assumptions
1.4.1. List of Data Sources
Chapter 2. Executive Summary
2.1. Market Outlook
2.2. Segment Outlook
2.3. Competitive Insights
Chapter 3. Distributed Fiber Optic Sensor Market Variables, Trends, & Scope
3.1. Market Introduction/Lineage Outlook
3.2. Market Value Chain Analysis
3.3. Market Dynamics
3.3.1. Market Driver Analysis
3.3.2. Market Restraint Analysis
3.3.3. Industry Challenge
3.4. Distributed Fiber Optic Sensor Market Analysis Tools
3.4.1. Porter’s Analysis
3.4.2. PESTEL Analysis
Chapter 4. Distributed Fiber Optic Sensor Market: Function Estimates & Trend Analysis
4.1. Segment Dashboard
4.2. Distributed Fiber Optic Sensor market: Function Movement Analysis, USD Million, 2025 & 2033
4.3. Acoustic/Vibration Sensing
4.3.1. Acoustic/Vibration Sensing Distributed Fiber Optic Sensor Market Revenue Estimates and Forecasts, 2021 – 2033 (USD Million)
4.4. Temperature Sensing
4.4.1. Temperature Sensing Distributed Fiber Optic Sensor Market Revenue Estimates and Forecasts, 2021 – 2033 (USD Million)
4.5. Other
4.5.1. Other Distributed Fiber Optic Sensor Market Revenue Estimates and Forecasts, 2021 – 2033 (USD Million)
Chapter 5. Distributed Fiber Optic Sensor Market: Technology Estimates & Trend Analysis
5.1. Segment Dashboard
5.2. Distributed Fiber Optic Sensor market: Technology Movement Analysis, USD Million, 2025 & 2033
5.3. Rayleigh Effect
5.3.1. Rayleigh Effect Distributed Fiber Optic Sensor Market Revenue Estimates and Forecasts, 2021 – 2033 (USD Million)
5.4. Brillouin Scattering
5.4.1. Brillouin Scattering Distributed Fiber Optic Sensor Market Revenue Estimates and Forecasts, 2021 – 2033 (USD Million)
5.5. Raman Effect
5.5.1. Raman Effect Distributed Fiber Optic Sensor Market Revenue Estimates and Forecasts, 2021 – 2033 (USD Million)
5.6. Interferometric
5.6.1. Interferometric Distributed Fiber Optic Sensor Market Revenue Estimates and Forecasts, 2021 – 2033 (USD Million)
5.7. Bragg Grating
5.7.1. Bragg Grating Distributed Fiber Optic Sensor Market Revenue Estimates and Forecasts, 2021 – 2033 (USD Million)
Chapter 6. Distributed Fiber Optic Sensor Market: Application Estimates & Trend Analysis
6.1. Segment Dashboard
6.2. Distributed Fiber Optic Sensor market: Application Movement Analysis, USD Million, 2025 & 2033
6.3. Geophysical Event Monitoring
6.3.1. Geophysical Event Monitoring Distributed Fiber Optic Sensor Market Revenue Estimates and Forecasts, 2021 – 2033 (USD Million)
6.4. Network Disturbance Monitoring
6.4.1. Network Disturbance Monitoring Distributed Fiber Optic Sensor Market Revenue Estimates and Forecasts, 2021 – 2033 (USD Million)
6.5. Rail Infrastructure Monitoring
6.5.1. Rail Infrastructure Monitoring Distributed Fiber Optic Sensor Market Revenue Estimates and Forecasts, 2021 – 2033 (USD Million)
6.6. Urban Monitoring
6.6.1. Urban Monitoring Distributed Fiber Optic Sensor Market Revenue Estimates and Forecasts, 2021 – 2033 (USD Million)
6.7. Subsea Infrastructure Monitoring
6.7.1. Subsea Infrastructure Monitoring Distributed Fiber Optic Sensor Market Revenue Estimates and Forecasts, 2021 – 2033 (USD Million)
6.8. Others
6.8.1. Others Distributed Fiber Optic Sensor Market Revenue Estimates and Forecasts, 2021 – 2033 (USD Million)
Chapter 7. Distributed Fiber Optic Sensor Market: Vertical Estimates & Trend Analysis
7.1. Segment Dashboard
7.2. Distributed Fiber Optic Sensor market: Vertical Movement Analysis, USD Million, 2025 & 2033
7.3. Oil and Gas
7.3.1. Oil and Gas Distributed Fiber Optic Sensor Market Revenue Estimates and Forecasts, 2021 – 2033 (USD Million)
7.4. Power and Utility
7.4.1. Power and Utility Distributed Fiber Optic Sensor Market Revenue Estimates and Forecasts, 2021 – 2033 (USD Million)
7.5. Safety and Security
7.5.1. Safety and Security Distributed Fiber Optic Sensor Market Revenue Estimates and Forecasts, 2021 – 2033 (USD Million)
7.6. Industrial
7.6.1. Industrial Distributed Fiber Optic Sensor Market Revenue Estimates and Forecasts, 2021 – 2033 (USD Million)
7.7. Civil Engineering
7.7.1. Civil Engineering Distributed Fiber Optic Sensor Market Revenue Estimates and Forecasts, 2021 – 2033 (USD Million)
Chapter 8. Distributed Fiber Optic Sensor Market: Regional Estimates & Trend Analysis
8.1. DFOS Share, By Region, 2025 & 2033 USD Million
8.2. North America
8.2.1. North America DFOS Estimates and Forecasts, 2025 – 2033 (USD Million)
8.2.1.1. North America DFOS Estimates and Forecasts, by Country, 2021 – 2033 (USD Million)
8.2.1.2. North America DFOS Estimates and Forecasts, by Function, 2021 – 2033 (USD Million)
8.2.1.3. North America DFOS Estimates and Forecasts, by Technology, 2021 – 2033 (USD Million)
8.2.1.4. North America DFOS Estimates and Forecasts, by Vertical, 2021 – 2033 (USD Million)
8.2.1.5. North America DFOS Estimates and Forecasts, by Application, 2021 – 2033 (USD Million)
8.2.2. U.S.
8.2.2.1. U.S. DFOS Estimates and Forecasts, 2021 – 2033 (USD Million)
8.2.2.2. U.S. DFOS Estimates and Forecasts, by Function, 2021 – 2033 (USD Million)
8.2.2.3. U.S. DFOS Estimates and Forecasts, by Technology, 2021 – 2033 (USD Million)
8.2.2.4. U.S. DFOS Estimates and Forecasts, by Vertical, 2021 – 2033 (USD Million)
8.2.2.5. U.S. DFOS Estimates and Forecasts, by Application, 2021 – 2033 (USD Million)
8.2.3. Canada
8.2.3.1. Canada DFOS Estimates and Forecasts, by Function, 2021 – 2033 (USD Million)
8.2.3.2. Canada DFOS Estimates and Forecasts, by Technology, 2021 – 2033 (USD Million)
8.2.3.3. Canada DFOS Estimates and Forecasts, by Vertical, 2021 – 2033 (USD Million)
8.2.3.4. Canada DFOS Estimates and Forecasts, by Application, 2021 – 2033 (USD Million)
8.2.4. Mexico
8.2.4.1. Mexico DFOS Estimates and Forecasts, by Function, 2021 – 2033 (USD Million)
8.2.4.2. Mexico DFOS Estimates and Forecasts, by Technology, 2021 – 2033 (USD Million)
8.2.4.3. Mexico DFOS Estimates and Forecasts, by Vertical, 2021 – 2033 (USD Million)
8.2.4.4. Mexico DFOS Estimates and Forecasts, by Application, 2021 – 2033 (USD Million)
8.3. Europe
8.3.1. Europe DFOS Estimates and Forecasts, 2025 – 2033 (USD Million)
8.3.1.1. Europe DFOS Estimates and Forecasts, by Country, 2021 – 2033 (USD Million)
8.3.1.2. Europe DFOS Estimates and Forecasts, by Function, 2021 – 2033 (USD Million)
8.3.1.3. Europe DFOS Estimates and Forecasts, by Technology, 2021 – 2033 (USD Million)
8.3.1.4. Europe DFOS Estimates and Forecasts, by Vertical, 2021 – 2033 (USD Million)
8.3.1.5. Europe DFOS Estimates and Forecasts, by Application, 2021 – 2033 (USD Million)
8.3.2. U.K.
8.3.2.1. U.K. DFOS Estimates and Forecasts, by Function, 2021 – 2033 (USD Million)
8.3.2.2. U.K. DFOS Estimates and Forecasts, by Technology, 2021 – 2033 (USD Million)
8.3.2.3. U.K. DFOS Estimates and Forecasts, by Vertical, 2021 – 2033 (USD Million)
8.3.2.4. U.K. DFOS Estimates and Forecasts, by Application, 2021 – 2033 (USD Million)
8.3.3. Germany
8.3.3.1. Germany DFOS Estimates and Forecasts, by Function, 2021 – 2033 (USD Million)
8.3.3.2. Germany DFOS Estimates and Forecasts, by Technology, 2021 – 2033 (USD Million)
8.3.3.3. Germany DFOS Estimates and Forecasts, by Vertical, 2021 – 2033 (USD Million)
8.3.3.4. Germany DFOS Estimates and Forecasts, by Application, 2021 – 2033 (USD Million)
8.3.4. France
8.3.4.1. France DFOS Estimates and Forecasts, by Function, 2021 – 2033 (USD Million)
8.3.4.2. France DFOS Estimates and Forecasts, by Technology, 2021 – 2033 (USD Million)
8.3.4.3. France DFOS Estimates and Forecasts, by Vertical, 2021 – 2033 (USD Million)
8.3.4.4. France DFOS Estimates and Forecasts, by Application, 2021 – 2033 (USD Million)
8.4. Asia Pacific
8.4.1. Asia Pacific DFOS Estimates and Forecasts, 2025 – 2033 (USD Million)
8.4.1.1. Asia Pacific DFOS Estimates and Forecasts, by Function, 2021 – 2033 (USD Million)
8.4.1.2. Asia Pacific DFOS Estimates and Forecasts, by Technology, 2021 – 2033 (USD Million)
8.4.1.3. Asia Pacific DFOS Estimates and Forecasts, by Vertical, 2021 – 2033 (USD Million)
8.4.1.4. Asia Pacific DFOS Estimates and Forecasts, by Application, 2021 – 2033 (USD Million)
8.4.2. China
8.4.2.1. China DFOS Estimates and Forecasts, 2021 – 2033 (USD Million)
8.4.2.2. China DFOS Estimates and Forecasts, by Function, 2021 – 2033 (USD Million)
8.4.2.3. China DFOS Estimates and Forecasts, by Technology, 2021 – 2033 (USD Million)
8.4.2.4. China DFOS Estimates and Forecasts, by Vertical, 2021 – 2033 (USD Million)
8.4.2.5. China DFOS Estimates and Forecasts, by Application, 2021 – 2033 (USD Million)
8.4.3. Japan
8.4.3.1. Japan DFOS Estimates and Forecasts, by Function, 2021 – 2033 (USD Million)
8.4.3.2. Japan DFOS Estimates and Forecasts, by Technology, 2021 – 2033 (USD Million)
8.4.3.3. Japan DFOS Estimates and Forecasts, by Vertical, 2021 – 2033 (USD Million)
8.4.3.4. Japan DFOS Estimates and Forecasts, by Application, 2021 – 2033 (USD Million)
8.4.4. India
8.4.4.1. India DFOS Estimates and Forecasts, by Function, 2021 – 2033 (USD Million)
8.4.4.2. India DFOS Estimates and Forecasts, by Technology, 2021 – 2033 (USD Million)
8.4.4.3. India DFOS Estimates and Forecasts, by Vertical, 2021 – 2033 (USD Million)
8.4.4.4. India DFOS Estimates and Forecasts, by Application, 2021 – 2033 (USD Million)
8.4.5. South Korea
8.4.5.1. South Korea DFOS Estimates and Forecasts, by Function, 2021 – 2033 (USD Million)
8.4.5.2. South Korea DFOS Estimates and Forecasts, by Technology, 2021 – 2033 (USD Million)
8.4.5.3. South Korea DFOS Estimates and Forecasts, by Vertical, 2021 – 2033 (USD Million)
8.4.5.4. South Korea DFOS Estimates and Forecasts, by Application, 2021 – 2033 (USD Million)
8.4.6. Australia
8.4.6.1. Australia DFOS Estimates and Forecasts, by Function, 2021 – 2033 (USD Million)
8.4.6.2. Australia DFOS Estimates and Forecasts, by Technology, 2021 – 2033 (USD Million)
8.4.6.3. Australia DFOS Estimates and Forecasts, by Vertical, 2021 – 2033 (USD Million)
8.4.6.4. Australia DFOS Estimates and Forecasts, by Application, 2021 – 2033 (USD Million)
8.5. Latin America
8.5.1. Latin America DFOS Estimates and Forecasts, 2025 – 2033 (USD Million)
8.5.1.1. Latin America DFOS Estimates and Forecasts, by Country, 2021 – 2033 (USD Million)
8.5.1.2. Latin America DFOS Estimates and Forecasts, by Function, 2021 – 2033 (USD Million)
8.5.1.3. Latin America DFOS Estimates and Forecasts, by Technology, 2021 – 2033 (USD Million)
8.5.1.4. Latin America DFOS Estimates and Forecasts, by Vertical, 2021 – 2033 (USD Million)
8.5.1.5. Latin America DFOS Estimates and Forecasts, by Application, 2021 – 2033 (USD Million)
8.5.2. Brazil
8.5.2.1. Brazil DFOS Estimates and Forecasts, 2021 – 2033 (USD Million)
8.5.2.2. Brazil DFOS Estimates and Forecasts, by Function, 2021 – 2033 (USD Million)
8.5.2.3. Brazil DFOS Estimates and Forecasts, by Technology, 2021 – 2033 (USD Million)
8.5.2.4. Brazil DFOS Estimates and Forecasts, by Vertical, 2021 – 2033 (USD Million)
8.5.2.5. Brazil DFOS Estimates and Forecasts, by Application, 2021 – 2033 (USD Million)
8.6. Middle East and Africa
8.6.1. Middle East and Africa DFOS Estimates and Forecasts, 2025 – 2033 (USD Million)
8.6.1.1. Middle East and Africa DFOS Estimates and Forecasts, by Function, 2021 – 2033 (USD Million)
8.6.1.2. Middle East and Africa DFOS Estimates and Forecasts, by Technology, 2021 – 2033 (USD Million)
8.6.1.3. Middle East and Africa DFOS Estimates and Forecasts, by Vertical, 2021 – 2033 (USD Million)
8.6.1.4. Middle East and Africa DFOS Estimates and Forecasts, by Application, 2021 – 2033 (USD Million)
8.6.2. UAE
8.6.2.1. UAE DFOS Estimates and Forecasts, by Function, 2021 – 2033 (USD Million)
8.6.2.2. UAE DFOS Estimates and Forecasts, by Technology, 2021 – 2033 (USD Million)
8.6.2.3. UAE DFOS Estimates and Forecasts, by Vertical, 2021 – 2033 (USD Million)
8.6.2.4. UAE DFOS Estimates and Forecasts, by Application, 2021 – 2033 (USD Million)
8.6.3. KSA
8.6.3.1. KSA DFOS Estimates and Forecasts, by Function, 2021 – 2033 (USD Million)
8.6.3.2. KSA DFOS Estimates and Forecasts, by Technology, 2021 – 2033 (USD Million)
8.6.3.3. KSA DFOS Estimates and Forecasts, by Vertical, 2021 – 2033 (USD Million)
8.6.3.4. KSA DFOS Estimates and Forecasts, by Application, 2021 – 2033 (USD Million)
8.6.4. South Africa
8.6.4.1. South Africa DFOS Estimates and Forecasts, by Function, 2021 – 2033 (USD Million)
8.6.4.2. South Africa DFOS Estimates and Forecasts, by Technology, 2021 – 2033 (USD Million)
8.6.4.3. South Africa DFOS Estimates and Forecasts, by Vertical, 2021 – 2033 (USD Million)
8.6.4.4. South Africa DFOS Estimates and Forecasts, by Application, 2021 – 2033 (USD Million)
Chapter 9. Competitive Landscape
9.1. Company Categorization
9.2. Company Market Positioning, 2025
9.3. Participant’s Overview
9.4. Financial Performance
9.5. Product Benchmarking
9.6. Company Heat Map Analysis
9.7. Strategy Mapping
9.8. Company Profiles/Listing
9.8.1. Luna Innovations Inc.
9.8.1.1. Participant’s Overview
9.8.1.2. Financial Performance
9.8.1.3. Product Benchmarking
9.8.1.4. Recent Developments
9.8.2. Schlumberger Limited
9.8.2.1. Participant’s Overview
9.8.2.2. Financial Performance
9.8.2.3. Product Benchmarking
9.8.2.4. Recent Developments
9.8.3. Halliburton
9.8.3.1. Participant’s Overview
9.8.3.2. Financial Performance
9.8.3.3. Product Benchmarking
9.8.3.4. Recent Developments
9.8.4. Yokogawa Electric Corporation
9.8.4.1. Participant’s Overview
9.8.4.2. Financial Performance
9.8.4.3. Product Benchmarking
9.8.4.4. Recent Developments
9.8.5. OFS Fitel, LLC
9.8.5.1. Participant’s Overview
9.8.5.2. Financial Performance
9.8.5.3. Product Benchmarking
9.8.5.4. Recent Developments
9.8.6. Omnisens SA
9.8.6.1. Participant’s Overview
9.8.6.2. Financial Performance
9.8.6.3. Product Benchmarking
9.8.6.4. Recent Developments
9.8.7. Brugg Kable AG
9.8.7.1. Participant’s Overview
9.8.7.2. Financial Performance
9.8.7.3. Product Benchmarking
9.8.7.4. Recent Developments
9.8.8. AP Sensing GmbH
9.8.8.1. Participant’s Overview
9.8.8.2. Financial Performance
9.8.8.3. Product Benchmarking
9.8.8.4. Recent Developments
9.8.9. Baker Hughes Company
9.8.9.1. Participant’s Overview
9.8.9.2. Financial Performance
9.8.9.3. Product Benchmarking
9.8.9.4. Recent Developments
9.8.10. Silixa Ltd
9.8.10.1. Participant’s Overview
9.8.10.2. Financial Performance
9.8.10.3. Product Benchmarking
9.8.10.4. Recent Developments
List of Tables
Table 1 Global Distributed Fiber Optic Sensor Market estimates and Forecasts by Region, 2021 – 2033 (USD Million)
Table 2 Global Distributed Fiber Optic Sensor Market estimates and Forecast by Function, 2021 – 2033 (USD Million)
Table 3 Global Distributed Fiber Optic Sensor Market estimates and Forecast by Technology, 2021 – 2033 (USD Million)
Table 4 Global Distributed Fiber Optic Sensor Market estimates and Forecast by Application, 2021 – 2033 (USD Million)
Table 5 Global Distributed Fiber Optic Sensor Market estimates and Forecast by Vertical, 2021 – 2033 (USD Million)
Table 6 North America Distributed Fiber Optic Sensor Market estimates and Forecast, 2021 – 2033 (USD Million)
Table 7 North America Distributed Fiber Optic Sensor Market estimates and Forecast, by Function, 2021 – 2033 (USD Million)
Table 8 North America Distributed Fiber Optic Sensor Market estimates and Forecast, by Technology, 2021 – 2033 (USD Million)
Table 9 North America Distributed Fiber Optic Sensor Market estimates and Forecast, by Application, 2021 – 2033 (USD Million)
Table 10 North America Distributed Fiber Optic Sensor Market estimates and Forecast, by Vertical, 2021 – 2033 (USD Million)
Table 11 U.S Distributed Fiber Optic Sensor Market estimates and Forecast, 2021 – 2033 (USD Million)
Table 12 U.S Distributed Fiber Optic Sensor Market estimates and Forecast, by Function, 2021 – 2033 (USD Million)
Table 13 U.S Distributed Fiber Optic Sensor Market estimates and Forecast, by Technology, 2021 – 2033 (USD Million)
Table 14 U.S Distributed Fiber Optic Sensor Market estimates and Forecast, by Application, 2021 – 2033 (USD Million)
Table 15 U.S Distributed Fiber Optic Sensor Market estimates and Forecast, by Vertical, 2021 – 2033 (USD Million)
Table 16 Canada Distributed Fiber Optic Sensor Market estimates and Forecast, 2021 – 2033 (USD Million)
Table 17 Canada Distributed Fiber Optic Sensor Market estimates and Forecast, by Function, 2021 – 2033 (USD Million)
Table 18 Canada Distributed Fiber Optic Sensor Market estimates and Forecast, by Technology, 2021 – 2033 (USD Million)
Table 19 Canada Distributed Fiber Optic Sensor Market estimates and Forecast, by Application, 2021 – 2033 (USD Million)
Table 20 Canada Distributed Fiber Optic Sensor Market estimates and Forecast, by Vertical, 2021 – 2033 (USD Million)
Table 21 Mexico Distributed Fiber Optic Sensor Market estimates and Forecast, 2021 – 2033 (USD Million)
Table 22 Mexico Distributed Fiber Optic Sensor Market estimates and Forecast, by Function, 2021 – 2033 (USD Million)
Table 23 Mexico Distributed Fiber Optic Sensor Market estimates and Forecast, by Technology, 2021 – 2033 (USD Million)
Table 24 Mexico Distributed Fiber Optic Sensor Market estimates and Forecast, by Application, 2021 – 2033 (USD Million)
Table 25 Mexico Distributed Fiber Optic Sensor Market estimates and Forecast, by Vertical, 2021 – 2033 (USD Million)
Table 26 Europe Distributed Fiber Optic Sensor Market estimates and Forecast, 2021 – 2033 (USD Million)
Table 27 Europe Distributed Fiber Optic Sensor Market estimates and Forecast, by Function, 2021 – 2033 (USD Million)
Table 28 Europe Distributed Fiber Optic Sensor Market estimates and Forecast, by Technology, 2021 – 2033 (USD Million)
Table 29 Europe Distributed Fiber Optic Sensor Market estimates and Forecast, by Application, 2021 – 2033 (USD Million)
Table 30 Europe Distributed Fiber Optic Sensor Market estimates and Forecast, by Vertical, 2021 – 2033 (USD Million)
Table 31 U.K Distributed Fiber Optic Sensor Market estimates and Forecast, 2021 – 2033 (USD Million)
Table 32 U.K Distributed Fiber Optic Sensor Market estimates and Forecast, by Function, 2021 – 2033 (USD Million)
Table 33 U.K Distributed Fiber Optic Sensor Market estimates and Forecast, by Technology, 2021 – 2033 (USD Million)
Table 34 U.K Distributed Fiber Optic Sensor Market estimates and Forecast, by Application, 2021 – 2033 (USD Million)
Table 35 U.K Distributed Fiber Optic Sensor Market estimates and Forecast, by Vertical, 2021 – 2033 (USD Million)
Table 36 Germany Distributed Fiber Optic Sensor Market estimates and Forecast, 2021 – 2033 (USD Million)
Table 37 Germany Distributed Fiber Optic Sensor Market estimates and Forecast, by Function, 2021 – 2033 (USD Million)
Table 38 Germany Distributed Fiber Optic Sensor Market estimates and Forecast, by Technology, 2021 – 2033 (USD Million)
Table 39 Germany Distributed Fiber Optic Sensor Market estimates and Forecast, by Application, 2021 – 2033 (USD Million)
Table 40 Germany Distributed Fiber Optic Sensor Market estimates and Forecast, by Vertical, 2021 – 2033 (USD Million)
Table 41 France Distributed Fiber Optic Sensor Market estimates and Forecast, 2021 – 2033 (USD Million)
Table 42 France Distributed Fiber Optic Sensor Market estimates and Forecast, by Function, 2021 – 2033 (USD Million)
Table 43 France Distributed Fiber Optic Sensor Market estimates and Forecast, by Technology, 2021 – 2033 (USD Million)
Table 44 France Distributed Fiber Optic Sensor Market estimates and Forecast, by Application, 2021 – 2033 (USD Million)
Table 45 France Distributed Fiber Optic Sensor Market estimates and Forecast, by Vertical, 2021 – 2033 (USD Million)
Table 46 Asia Pacific Distributed Fiber Optic Sensor Market estimates and Forecast, 2021 – 2033 (USD Million)
Table 47 Asia Pacific Distributed Fiber Optic Sensor Market estimates and Forecast, by Function, 2021 – 2033 (USD Million)
Table 48 Asia Pacific Distributed Fiber Optic Sensor Market estimates and Forecast, by Technology, 2021 – 2033 (USD Million)
Table 49 Asia Pacific Distributed Fiber Optic Sensor Market estimates and Forecast, by Application, 2021 – 2033 (USD Million)
Table 50 Asia Pacific Distributed Fiber Optic Sensor Market estimates and Forecast, by Vertical, 2021 – 2033 (USD Million)
Table 51 China Distributed Fiber Optic Sensor Market estimates and Forecast, 2021 – 2033 (USD Million)
Table 52 China Distributed Fiber Optic Sensor Market estimates and Forecast, by Function, 2021 – 2033 (USD Million)
Table 53 China Distributed Fiber Optic Sensor Market estimates and Forecast, by Technology, 2021 – 2033 (USD Million)
Table 54 China Distributed Fiber Optic Sensor Market estimates and Forecast, by Application, 2021 – 2033 (USD Million)
Table 55 China Distributed Fiber Optic Sensor Market estimates and Forecast, by Vertical, 2021 – 2033 (USD Million)
Table 56 Japan Distributed Fiber Optic Sensor Market estimates and Forecast, 2021 – 2033 (USD Million)
Table 57 Japan Distributed Fiber Optic Sensor Market estimates and Forecast, by Function, 2021 – 2033 (USD Million)
Table 58 Japan Distributed Fiber Optic Sensor Market estimates and Forecast, by Technology, 2021 – 2033 (USD Million)
Table 59 Japan Distributed Fiber Optic Sensor Market estimates and Forecast, by Application, 2021 – 2033 (USD Million)
Table 60 Japan Distributed Fiber Optic Sensor Market estimates and Forecast, by Vertical, 2021 – 2033 (USD Million)
Table 61 India Distributed Fiber Optic Sensor Market estimates and Forecast, 2021 – 2033 (USD Million)
Table 62 India Distributed Fiber Optic Sensor Market estimates and Forecast, by Function, 2021 – 2033 (USD Million)
Table 63 India Distributed Fiber Optic Sensor Market estimates and Forecast, by Technology, 2021 – 2033 (USD Million)
Table 64 India Distributed Fiber Optic Sensor Market estimates and Forecast, by Application, 2021 – 2033 (USD Million)
Table 65 India Distributed Fiber Optic Sensor Market estimates and Forecast, by Vertical, 2021 – 2033 (USD Million)
Table 66 South Korea Distributed Fiber Optic Sensor Market estimates and Forecast, 2021 – 2033 (USD Million)
Table 67 South Korea Distributed Fiber Optic Sensor Market estimates and Forecast, by Function, 2021 – 2033 (USD Million)
Table 68 South Korea Distributed Fiber Optic Sensor Market estimates and Forecast, by Technology, 2021 – 2033 (USD Million)
Table 69 South Korea Distributed Fiber Optic Sensor Market estimates and Forecast, by Application, 2021 – 2033 (USD Million)
Table 70 South Korea Distributed Fiber Optic Sensor Market estimates and Forecast, by Vertical, 2021 – 2033 (USD Million)
Table 71 Australia Distributed Fiber Optic Sensor Market estimates and Forecast, 2021 – 2033 (USD Million)
Table 72 Australia Distributed Fiber Optic Sensor Market estimates and Forecast, by Function, 2021 – 2033 (USD Million)
Table 73 Australia Distributed Fiber Optic Sensor Market estimates and Forecast, by Technology, 2021 – 2033 (USD Million)
Table 74 Australia Distributed Fiber Optic Sensor Market estimates and Forecast, by Application, 2021 – 2033 (USD Million)
Table 75 Australia Distributed Fiber Optic Sensor Market estimates and Forecast, by Vertical, 2021 – 2033 (USD Million)
Table 76 Latin America Distributed Fiber Optic Sensor Market estimates and Forecast, 2021 – 2033 (USD Million)
Table 77 Latin America Distributed Fiber Optic Sensor Market estimates and Forecast, by Function, 2021 – 2033 (USD Million)
Table 78 Latin America Distributed Fiber Optic Sensor Market estimates and Forecast, by Technology, 2021 – 2033 (USD Million)
Table 79 Latin America Distributed Fiber Optic Sensor Market estimates and Forecast, by Application, 2021 – 2033 (USD Million)
Table 80 Latin America Distributed Fiber Optic Sensor Market estimates and Forecast, by Vertical, 2021 – 2033 (USD Million)
Table 81 Brazil Distributed Fiber Optic Sensor Market estimates and Forecast, 2021 – 2033 (USD Million)
Table 82 Brazil Distributed Fiber Optic Sensor Market estimates and Forecast, by Function, 2021 – 2033 (USD Million)
Table 83 Brazil Distributed Fiber Optic Sensor Market estimates and Forecast, by Technology, 2021 – 2033 (USD Million)
Table 84 Brazil Distributed Fiber Optic Sensor Market estimates and Forecast, by Application, 2021 – 2033 (USD Million)
Table 85 Brazil Distributed Fiber Optic Sensor Market estimates and Forecast, by Vertical, 2021 – 2033 (USD Million)
Table 86 MEA Distributed Fiber Optic Sensor Market estimates and Forecast, 2021 – 2033 (USD Million)
Table 87 MEA Distributed Fiber Optic Sensor Market estimates and Forecast, by Function, 2021 – 2033 (USD Million)
Table 88 MEA Distributed Fiber Optic Sensor Market estimates and Forecast, by Technology, 2021 – 2033 (USD Million)
Table 89 MEA Distributed Fiber Optic Sensor Market estimates and Forecast, by Application, 2021 – 2033 (USD Million)
Table 90 MEA Distributed Fiber Optic Sensor Market estimates and Forecast, by Vertical, 2021 – 2033 (USD Million)
Table 91 KSA Distributed Fiber Optic Sensor Market estimates and Forecast, 2021 – 2033 (USD Million)
Table 92 KSA Distributed Fiber Optic Sensor Market estimates and Forecast, by Function, 2021 – 2033 (USD Million)
Table 93 KSA Distributed Fiber Optic Sensor Market estimates and Forecast, by Technology, 2021 – 2033 (USD Million)
Table 94 KSA Distributed Fiber Optic Sensor Market estimates and Forecast, by Application, 2021 – 2033 (USD Million)
Table 95 KSA Distributed Fiber Optic Sensor Market estimates and Forecast, by Vertical, 2021 – 2033 (USD Million)
Table 96 UAE Distributed Fiber Optic Sensor Market estimates and Forecast, 2021 – 2033 (USD Million)
Table 97 UAE Distributed Fiber Optic Sensor Market estimates and Forecast, by Function, 2021 – 2033 (USD Million)
Table 98 UAE Distributed Fiber Optic Sensor Market estimates and Forecast, by Technology, 2021 – 2033 (USD Million)
Table 99 UAE Distributed Fiber Optic Sensor Market estimates and Forecast, by Application, 2021 – 2033 (USD Million)
Table 100 UAE Distributed Fiber Optic Sensor Market estimates and Forecast, by Vertical, 2021 – 2033 (USD Million)
Table 101 South Africa Distributed Fiber Optic Sensor Market estimates and Forecast, 2021 – 2033 (USD Million)
Table 102 South Africa Distributed Fiber Optic Sensor Market estimates and Forecast, by Function, 2021 – 2033 (USD Million)
Table 103 South Africa Distributed Fiber Optic Sensor Market estimates and Forecast, by Technology, 2021 – 2033 (USD Million)
Table 104 South Africa Distributed Fiber Optic Sensor Market estimates and Forecast, by Application, 2021 – 2033 (USD Million)
Table 105 South Africa Distributed Fiber Optic Sensor Market estimates and Forecast, by Vertical, 2021 – 2033 (USD Million)
List of Figures
Fig. 1 Distributed Fiber Optic Sensor Market segmentation
Fig. 2 Market research process
Fig. 3 Information procurement
Fig. 4 Primary research pattern
Fig. 5 Market research approaches
Fig. 6 Market formulation & validation
Fig. 7 Distributed Fiber Optic Sensor Market snapshot
Fig. 8 Distributed Fiber Optic Sensor Market segment snapshot
Fig. 9 Distributed Fiber Optic Sensor Market competitive landscape snapshot
Fig. 10 Market driver impact analysis
Fig. 11 Market restraint impact analysis
Fig. 12 Distributed Fiber Optic Sensor Market: Function outlook key takeaways (USD million)
Fig. 13 Distributed Fiber Optic Sensor Market: Function movement analysis (USD million), 2025 & 2033
Fig. 14 Acoustic/Vibration Sensing Market Revenue estimates and forecasts, 2021 – 2033 (USD million)
Fig. 15 Temperature Sensing Market Revenue estimates and forecasts, 2021 – 2033 (USD million)
Fig. 16 Other Market Revenue estimates and forecasts, 2021 – 2033 (USD million)
Fig. 17 Distributed Fiber Optic Sensor Market: Technology outlook key takeaways (USD million)
Fig. 18 Distributed Fiber Optic Sensor Market: Technology movement analysis (USD million), 2025 & 2033
Fig. 19 Rayleigh Effect Market Revenue estimates and forecasts, 2021 – 2033 (USD million)
Fig. 20 Brillouin Scattering Market Revenue estimates and forecasts, 2021 – 2033 (USD million)
Fig. 21 Raman Effect Market Revenue estimates and forecasts, 2021 – 2033 (USD million)
Fig. 22 Interferometric Market Revenue estimates and forecasts, 2021 – 2033 (USD million)
Fig. 23 Bragg Grating Market Revenue estimates and forecasts, 2021 – 2033 (USD million)
Fig. 24 Distributed Fiber Optic Sensor Market: Application outlook key takeaways (USD million)
Fig. 25 Distributed Fiber Optic Sensor Market: Application movement analysis (USD million), 2025 & 2033
Fig. 26 Geophysical Event Monitoring Market Revenue estimates and forecasts, 2021 – 2033 (USD million)
Fig. 27 Network Disturbance Monitoring Market Revenue estimates and forecasts, 2021 – 2033 (USD million)
Fig. 28 Rail Infrastructure Monitoring Market Revenue estimates and forecasts, 2021 – 2033 (USD million)
Fig. 29 Urban Monitoring Market Revenue estimates and forecasts, 2021 – 2033 (USD million)
Fig. 30 Subsea Infrastructure Monitoring Market Revenue estimates and forecasts, 2021 – 2033 (USD million)
Fig. 31 Others Market Revenue estimates and forecasts, 2021 – 2033 (USD million)
Fig. 32 Distributed Fiber Optic Sensor Market: Vertical outlook key takeaways (USD million)
Fig. 33 Distributed Fiber Optic Sensor Market: Vertical movement analysis (USD million), 2025 & 2033
Fig. 34 Oil and Gas Market Revenue estimates and forecasts, 2021 – 2033 (USD million)
Fig. 35 Power and Utility Market Revenue estimates and forecasts, 2021 – 2033 (USD million)
Fig. 36 Safety and Security Market Revenue estimates and forecasts, 2021 – 2033 (USD million)
Fig. 37 Industrial Market Revenue estimates and forecasts, 2021 – 2033 (USD million)
Fig. 38 Civil Engineering Market Revenue estimates and forecasts, 2021 – 2033 (USD million)
Fig. 39 Regional Marketplace: Key takeaways
Fig. 40 Distributed Fiber Optic Sensor Market: Regional outlook, 2025 & 2033, USD Million
Fig. 41 North America Distributed Fiber Optic Sensor Market estimates and forecasts, 2021 – 2033 (USD million)
Fig. 42 U.S. Distributed Fiber Optic Sensor Market estimates and forecasts, 2021 – 2033 (USD million)
Fig. 43 Canada Distributed Fiber Optic Sensor Market estimates and forecasts, 2021 – 2033 (USD million)
Fig. 44 Mexico Distributed Fiber Optic Sensor Market estimates and forecasts, 2021 – 2033 (USD million)
Fig. 45 Europe Distributed Fiber Optic Sensor Market estimates and forecasts, 2021 – 2033 (USD million)
Fig. 46 UK Distributed Fiber Optic Sensor Market estimates and forecasts, 2021 – 2033 (USD million)
Fig. 47 Germany Distributed Fiber Optic Sensor Market estimates and forecasts, 2021 – 2033 (USD million)
Fig. 48 France Distributed Fiber Optic Sensor Market estimates and forecasts, 2021 – 2033 (USD million)
Fig. 49 Asia Pacific Distributed Fiber Optic Sensor Market estimates and forecasts, 2021 – 2033 (USD million)
Fig. 50 China Distributed Fiber Optic Sensor Market estimates and forecasts, 2021 – 2033 (USD million)
Fig. 51 Japan Distributed Fiber Optic Sensor Market estimates and forecasts, 2021 – 2033 (USD million)
Fig. 52 India Distributed Fiber Optic Sensor Market estimates and forecasts, 2021 – 2033 (USD million)
Fig. 53 South Korea Distributed Fiber Optic Sensor Market estimates and forecasts, 2021 – 2033 (USD million)
Fig. 54 Australia Distributed Fiber Optic Sensor Market estimates and forecasts, 2021 – 2033 (USD million)
Fig. 55 Latin America Distributed Fiber Optic Sensor Market estimates and forecasts, 2021 – 2033 (USD million)
Fig. 56 Brazil Distributed Fiber Optic Sensor Market estimates and forecasts, 2021 – 2033 (USD million)
Fig. 57 MEA Distributed Fiber Optic Sensor Market estimates and forecasts, 2021 – 2033 (USD million)
Fig. 58 KSA Distributed Fiber Optic Sensor Market estimates and forecasts, 2021 – 2033 (USD million)
Fig. 59 UAE Distributed Fiber Optic Sensor Market estimates and forecasts, 2021 – 2033 (USD million)
Fig. 60 South Africa Distributed Fiber Optic Sensor Market estimates and forecasts, 2021 – 2033 (USD million)
Fig. 61 Company Categorization
Fig. 62 Company Market Positioning, 2025
Fig. 63 Strategy framework